
Top 20 occupations in demand nationally
| No. | Occupation | IVI job ads* |
| 1 | Registered Nurses | 8,377 |
| 2 | Software and Applications Programmers | 6,269 |
| 3 | Aged and Disabled Carers | 4,642 |
| 4 | Child Carers | 4,277 |
| 5 | Construction Managers | 4,230 |
| 6 | Motor Mechanics | 3,924 |
| 7 | Retail Managers | 3,777 |
| 8 | Chefs | 3,725 |
| 9 | Generalist Medical Practitioners | 3,352 |
| 10 | Metal Fitters and Machinists | 3,137 |
| 11 | ICT Business and Systems Analysts | 3,053 |
| 12 | Civil Engineering Professionals | 2,871 |
| 13 | Electricians | 2,839 |
| 14 | Early Childhood (Pre-primary School) Teachers | 2,493 |
| 15 | Contract, Program and Project Administrators | 2,392 |
| 16 | Advertising and Marketing Professionals | 2,265 |
| 17 | Physiotherapists | 1,262 |
| 18 | Gardeners | 1,015 |
| 19 | Mining Engineers | 957 |
| 20 | Database and Systems Administrators, and ICT Security Specialists | 942 |
Notes: IVI data are October to December 2022 monthly average
- National Skills Commission, Skills Priority List, 2022; National Skills Commission, Employment outlook Industry and occupation trends over the five years to November 2026, 2022; JSA, Internet Vacancy Index, December 2022
This list, like the SPL, represents a diverse mix of occupations including, health care, digital, construction and engineering professionals, as well as traditional trades workers. It is important to recognise, however, that there are many, many more occupations of key significance to the economy and the well being of Australians.
Regional skills pressures
To help gain a better understanding of regional skills pressures, the National Skills Commission developed an indicator based on the ratio of online job ads (IVI) to employment at the regional level, which Jobs and Skills Australia will continue to develop and use in the future. This regional skills pressure indicator can be combined with findings from the SPL to test current labour demand pressures for occupations on a region-by-region basis.
Table below presents the top 10 vacancy rates (job ads as a proportion of employment) from the regional skills pressure indicator, for larger employing occupations that have been assessed as in shortage for the SPL. Occupations with the highest vacancy rates are heavily concentrated around Mining Engineers and medical professions, mostly in regional areas.
Top 10 regions/occupations by vacancy rate (November 2022), for occupations in shortage on the SPL
| Region | Occupation | Vacancy Rate (%) |
| Western Australia – Outback (North) | Mining Engineers | 38.0 |
| Western Australia – Outback (South) | Mining Engineers | 29.4 |
| Newcastle and Lake Macquarie | Mining Engineers | 22.7 |
| Far West and Orana | General Practitioners and Resident Medical Officers | 18.1 |
| Queensland – Outback | Chefs | 17.6 |
| Latrobe – Gippsland | Occupational Therapists | 17.5 |
| Latrobe – Gippsland | Enrolled and Mothercraft Nurses | 17.3 |
| Central Queensland | Mining Engineers | 17.2 |
| Australian Capital Territory | Other Miscellaneous Technicians and Trades Workers | 16.9 |
| Queensland – Outback | General Practitioners and Resident Medical Officers | 16.0 |
Notes: Regions presented in this table are Statistical Area 4 (SA4) regions, with the exception of capital cities, where relevant SA4 regions are combined to present an overall result for that capital city.
- National Skills Commission, 2022 Skills Priority List; JSA, Internet Vacancy Index, November 2022; Nowcast of employment by Region and Occupation, November 2022.
By examining similar figures for particular occupations that are assessed as being in shortage, the regions also experiencing high vacancy rates can also be identified. In effect, this provides an indication of the variations in regional skills pressures for any given occupation.
Labour demand and recruitment difficulty remain highest for the higher skill levels
Some of the recent trends in the percentage growth (or in some cases, decline) of IVI job advertisements should be viewed in the context of overall job advertisement volumes and employment growth.
For example, the percentage growth in job advertisements is highest for Skill Level 1 (up by 11.7%) and lowest for Skill Level 5 (down by 7.9%), compared to twelve months ago. As Table 5 highlights, the number of Skill Level 1 job advertisements far outweighs the other skill levels – making up just over one-third of all advertisements.

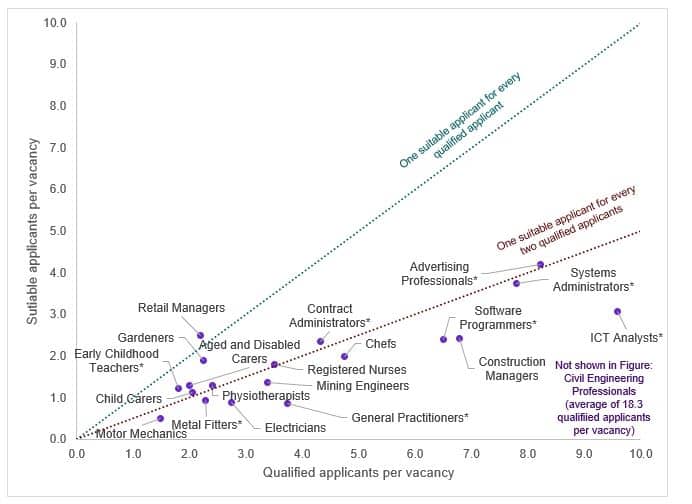
Qualified applicants per vacancy and suitable applicants per vacancy, select occupations
Labour markets for occupations often differ – employers across different occupations generally receive different numbers of applicants, have different mandatory qualification and experience requirements, and therefore find different proportions of applicants to be suitable.
Many occupations in shortage have fewer than one suitable applicant for every two qualified applicants. Retail Managers appear to be exception to this trend, with some employers not requiring mandatory qualifications in order to assess an applicant as suitable for filling these vacancies.


Temporary humanitarian stay (Sc 449) for Iranians
Australian Visa Changes from 1 July 2026: Higher Fees, New Income Thresholds and Working Holiday Updates
Federal Budget 2026–27: Key Migration and Visa Changes for Australia
Skilled Partner Points and Changes in Marital Status for Subclass 190 Visa Applicants
Partner Visa Processing Update (April 2026): What Applicants Must Know